
 Home
Home
The ActoGraph software
To know more
The ActoGraph project
ActoGraph is designed and developed in collaboration with human activity experts (mostly ergonomists) and as a part of a transversal research project including ergonomics, social and computer sciences. The software is made of a "core" component that provides the main features of the tool. Open-Source extension modules will be available in the future and they will able to attach themselves to the "core" component. The core part of the software will stay under a commercial license and its development, maintenance and evolution are managed by
Main features
ActoGraph allows to collect observation readings, to analyze and to generate activity graphs. Features of the software "core" are:
- Design observation protocol from scratch or template
- Record observation data in a systematic way
- Generate activity graphs from a given protocol and observation data
- Save and load your chronicles (protocol, observation data and graph)
- Work with audio or video media and use them to record data
Concept and methods
ActoGraph development process is monitored by the steering committee members. The project is guided by conceptual work and methodological reflexions about human activity and its study in ergonomics [1, 2, 3]. then concept of activity analysis based on systematic observations is especially used in the software [4, 5, 6].
Multi-platform and mobile
The tool is designed to work on different systems (Windows, Mac and Linux) and mobile applications are available for iOS and Android. Mobile applications allow the user to record observation data directly from the field with his favorite device.
[1] Guérin, F., Laville, A., Daniellou, F., Duraffourg, J., Kerguelen, A. (2001). Comprendre le travail pour le transformer. Lyon: ANACT.
[2] Kerguelen, A. (2008). "Actogram Kronos" : un outil d'aide à l'analyse de l'activité. In M. Norimatsu & N. Pigem (Eds.), Les techniques d'observation en sciences humaines. Paris: Armand Colin.
[3] Delgoulet, C., Kerguelen, A., Barthe, B. (2000). Vers une analyse intégrée des communications et des actions au travail : quelles modalités de leur mise en relation ? Communications et travail. Actes du 35e congrès de la Self (pp. 363-375). Toulouse: SELF.
[4] Barthe, B. (2008). Le travail de nuit à l’hôpital : comment appréhender la dimension collective du travail à partir de l’observation. In H. Norimatsu et N. Pigem (Eds). Les techniques d’observation en sciences humaines (pp. 108-119), Paris : Armand Colin.
[5] Delgoulet, C. (2008). Apprentissage en binôme. Exemple de codage et d’analyse d’une série temporelle auprès d’agents de maintenance ferroviaire en formation. In H. Norimatsu et N. Pigem (Eds). Les techniques d’observation en sciences humaines (pp. 90-99), Paris : Armand Colin.
[6] Kerguelen, A. (1995). Description et quantification en analyse ergonomique du travail : le cas de l’observation systématique. Dans "L'usage des méthodes statistiques dans l'étude du travail : journée-débat du 19 janvier 1994". Cahier Travail et Emploi, pp. 131-139.
The concept of chronicle in Actograph
A chronicle is made of three key elements in Actograph: a protocol, some observation data (timestamped readings) and an activity graph. Note that the saving of a chronicle write all this information on the disk of the user in a single ".chronic" file. In general, three steps are required to create a new chronicle: definition of the protocol (before the observation), recording of the data (observation) and the creation of the activity graph and associated statistics (analyze).
1. Protocol construction
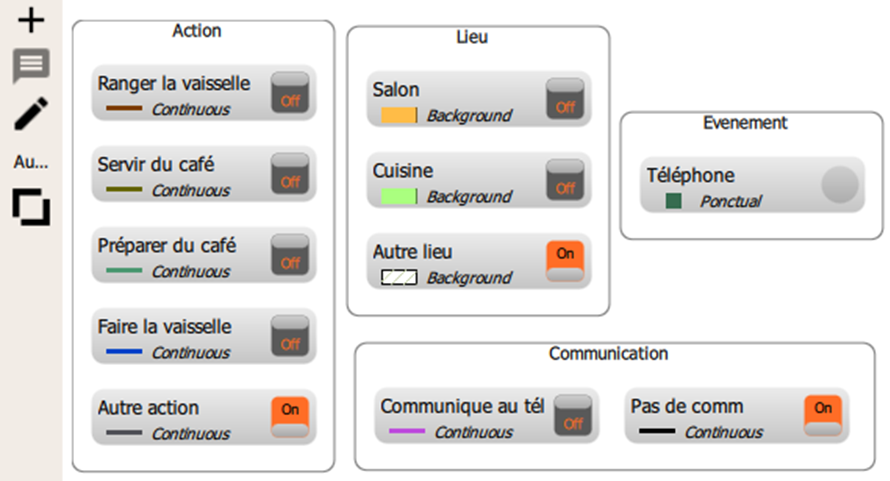
Observables organized in several categories.
- Construction of an observables and categories tree
- Hierarchical organization of the observables and categories
- Associate additional data such as label, color or visibility to each observable or category
2. Data recording
- Manual data entry using auto-generated buttons
- Drop-down menu of labels to quickly characterize the observables
- Associate audio or video media to the chronicle
- Two observation mods: chronometer or calendar
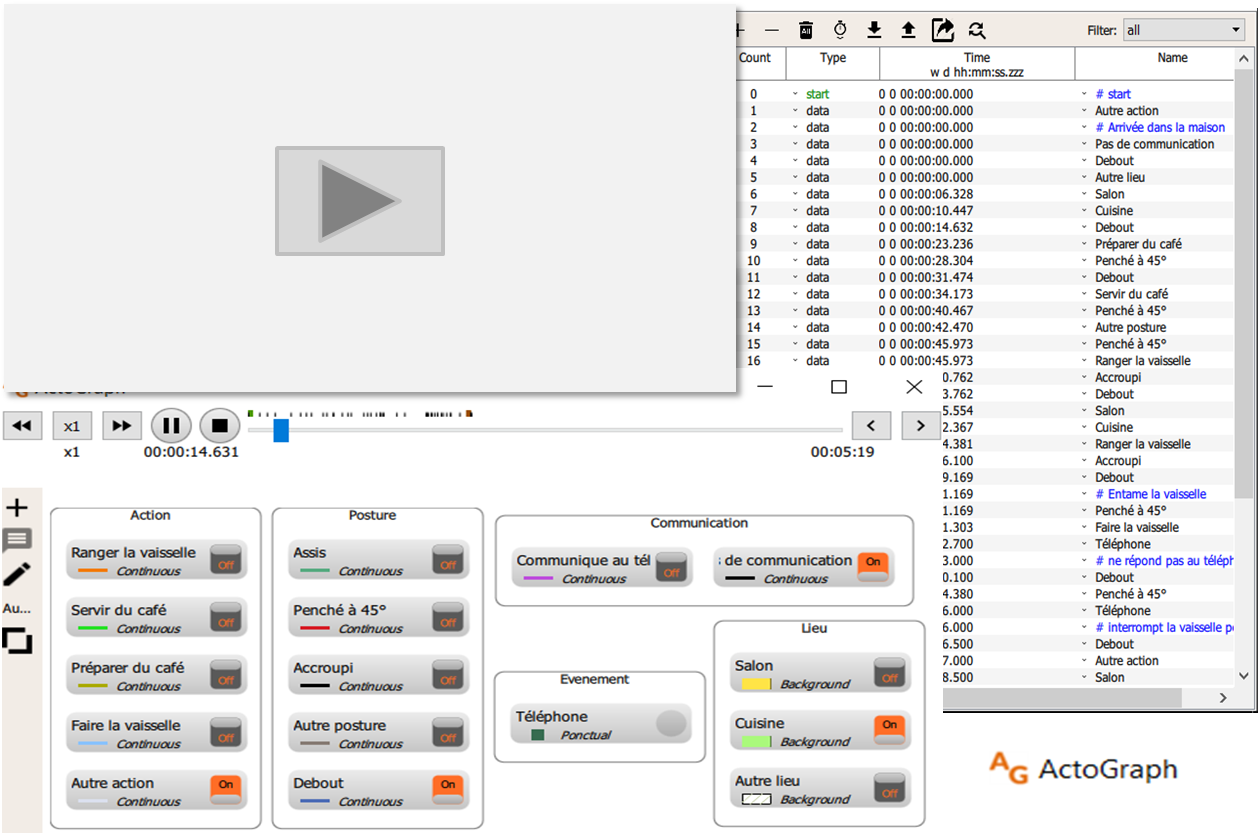
Timestamped readings (chronometer mod) recorded from a video shown by the blue square.
3. Activity graph
- Customize or auto-adjust the graph
- Specify the time range of interest
- Show or hide the observables and categories
- Export the graph to an image
- Compute statistics for each category and combine them
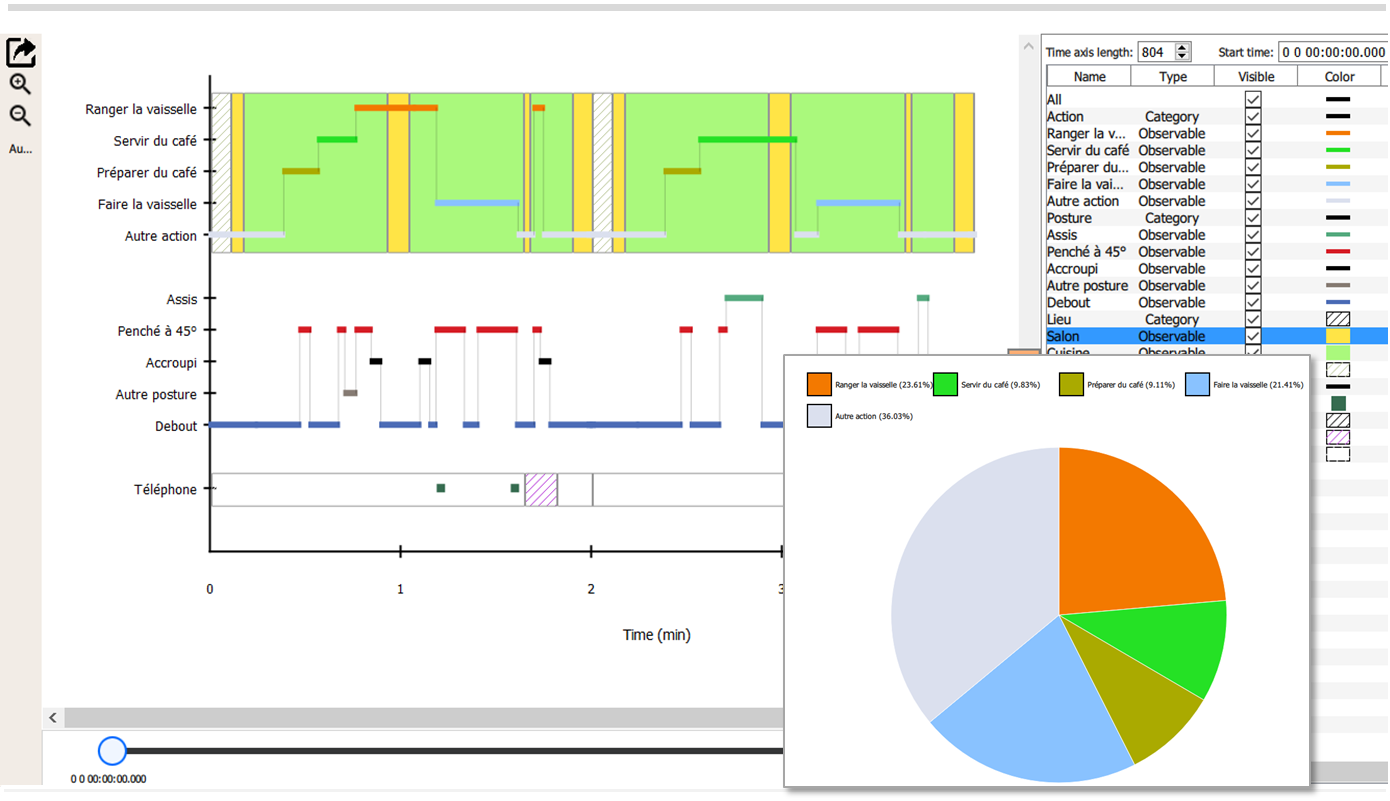
Activity graph built from a protocol and a set of readings.
Commercialization
ActoGraph is commercialized to ensure its maintenance and evolution on the long run. Pricing results from a balance between these requirements and our wish to make the software as accessible as possible. As such, the current compromise is to offer a free license for students and paid licenses to others.
Mobility and community
Users with a license will have access to the software and its mobile applications. In the futur, they will be able to customize the tool with their own Open-Source extensions.
Technology
The source code of ActoGraph is divided in two parts: model and interface. Model manages the raw data and the different mechanisms associated with them whereas the interface part deals with their presentation on the screen. This organization allows a lot of interface modifications without impacting in any way the model part of the code. From a technical point of view, the model part is written in C++ which is a generalist and fast computer language and the interface part in QML which is a descriptive and very flexible language.
Project timeline
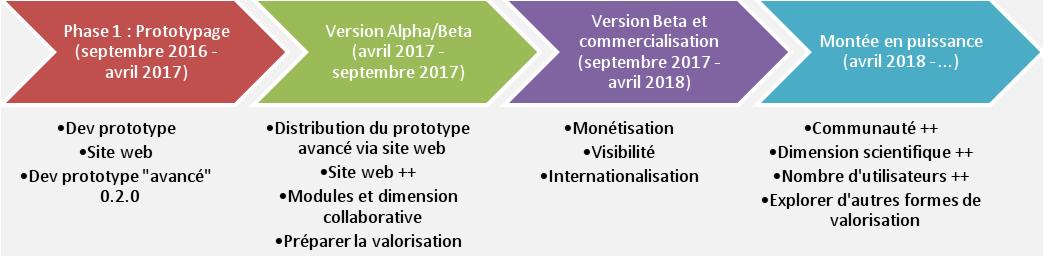
The four main steps of the ActoGraph project. Dates are given for information only and will evolve according to real-world difficulties.